At its most basic, Google Sheets depicts data as a series of columns and rows. But while that can be an accurate way to show data, it isn’t necessarily a compelling one.
Google Sheets has a number of “infographic”-like features that make it possible to display information visually. If you’re familiar with reporting functions in other software systems, you may already be familiar with the basics — pie charts, bar charts, and scatter plots.
But what Google Sheets doesn’t have is a built-in method of building a dot plot. Because there’s no dot plot Google Sheets function, you have to build your own. Luckily, we’ve created an easy step-by-step tutorial for you to achieve this.
Let’s take a look at how to make a dot plot in Google Sheets — and the other types of charts that might be a good alternative.
This Article Covers:
What is a Dot Plot?
Dot plots are an interesting and clear way to express relatively simple information. An easy way to understand this is through an example.
Our friend Tina is trying to determine when her website gets the most clicks. She’s compiled her information — the days of the weeks and the average number of clicks she receives on each day.

That’s fine, but it’s not very easy to read. With some scanning and interpretation, you can tell that Friday is her busiest day — but it takes a little work and processing.
Much easier would be to see this data on a chart, like so:

But that’s not a dot plot. A dot plot would show individual dots for each click instead of a solid bar.
This is what a dot plot looks like, generated from another website entirely:

It’s very easy to understand this dot plot. You can immediately intuit that Friday is a better day to post things than Saturday, for instance, because there’s more traffic and activity.
But to get this type of plot in Google Sheets is going to take a little work.
Why Isn’t There a Dot Plot in Google Sheets?
In Google Sheets, the “column chart” function mostly replaces the dot plot. A column chart can be used for any quantity, from 1 to 1,000,000. But a dot plot has minimal utility specifically because there is a dot for each discrete unit. Add more than 20 onto a dot plot, and you’re going to see some pretty extreme results.
But Google Sheets is quite extensible. Even though there isn’t a built-in dot plot graph into Google Sheets, there are methods of making something that will look like a dot plot.
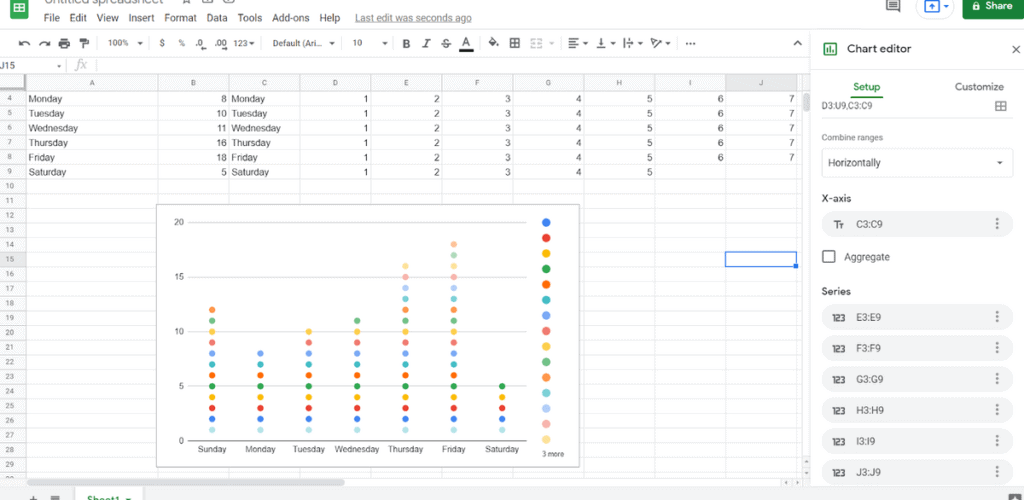
How to Make a Dot Plot in Google Sheets: Using a Scatter Plot
Creating a dot plot in Google Sheets using a scatter plot is a little complicated, but it should yield good results.
1. Copy the title data over to a second column (column C).

2. In column D, type in “sequence(1,b3:b9)” and then copy this down column D.

3. Select the “Clicks” data and then click on Insert -> Chart.

4. Modify the chart like so:
- Chart Type: Scatter
- X-Axis: C3:C9
- Use Column C as Labels

This gives you something that looks very much like a scatter plot. Sometimes, some data may be missing on this dot plot in Google Sheets. Go through the “Series” data to make sure that all the appropriate data has been selected.
Why Would You Make a Dot Plot in Google Sheets?
You would choose to make a dot plot in Google sheets if:
- Your data is brief and best understood visually.
- A graph makes it more difficult to understand the differences between columns.
- You’re looking less for trends and more for discrete information.
There are a lot of alternatives to dot plots that are built into Google Sheets, including bar charts and trend lines. But dot plots can be useful if you’re trying to display small amounts of discrete information.
How Else Can You Display Data in Google Sheets?
If we just select the data on Tina’s sheet and then click on Insert -> Chart, we can see a number of different ways to display data — some of which might be more useful than a dot plot.
The default is a line chart:

While it doesn’t show discrete data, it does show that there are trends occurring.
Another type of chart is a pie chart:

Here you can easily see that there’s a distribution of 22.5 percent of clicks on Friday. It’s not as easy to read in this instance as a line chart (or the before-mentioned column chart) because it doesn’t really show trends. You have to hunt around a bit to see the differences between, say, Monday and Tuesday, even though the differences between Friday and Saturday are very obvious.
Another type of chart is the bar chart:

A bar chart is essentially the same as a column chart, except for its orientation. While there are some other differences, you can think of it as a horizontal column chart.
There are even some more advanced types of chart, such as the waterfall chart, which expresses each number of clicks as a part of a greater whole:

And there’s the radar chart, which — while a little fancy — can be a little difficult to read.

But the radar chart does show the quantity (clicks) relevant to the time (day) very clearly.
There are not only a lot of built-in charts, but there are a lot of ways to customize these charts as well.
Taking Your Next Steps
As you can see, it’s not easy to make a dot plot in Google Sheets, mostly because Google Sheets isn’t designed to make a dot plot by default.
There are other charts that are just built right in, but when it comes to dot plots, you’re going to need to heavily modify a “Scatter Plot” to get the results you need.
Still, because Google Sheets is such a robust software solution, there are ways that you can achieve it. Nearly everything can be done in Google Sheets if you’re willing to complete a bit of a workaround.