Charts & Graphs

61760How to Create a Funnel Chart in Google Sheets

How to Create a Funnel Chart in Google Sheets [Step-by-Step]

  There are several ways you can visualize your data in Google Sheets. Unfortunately, there is no simple funnel chart setting, so you have to be a little creative. You could perhaps set up a script to speed up the process for future funnel charts. Read on to learn a few different methods of how to […]

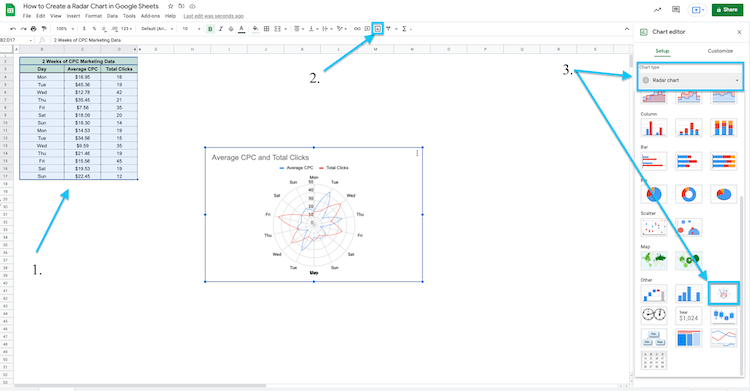
61112 radar chart google sheets

Easy Step-By-Step Radar Chart Google Sheets Guide

Watch – Radar Chart Google Sheets Video Tutorial   Google Sheets radar charts are an effective tool for visualizing data sets to compare and contrast. A radar chart will provide the end-user with a quick, clear picture of the top KPIs. Why Use a Google Sheets Radar Chart? As the business world continues to evolve […]

61081How to Create a Combo Chart in Google Sheets

How to Create a Combo Chart in Google Sheets (Step-by-Step)

  It is no surprise that Google Sheets is great at storing data. Google Sheets is also well equipped with easily created charts and graphs, providing a visual representation of the data. These charts are easily made, edited, and customized. However, many users may not know how to use these charts, so this tutorial will discuss […]

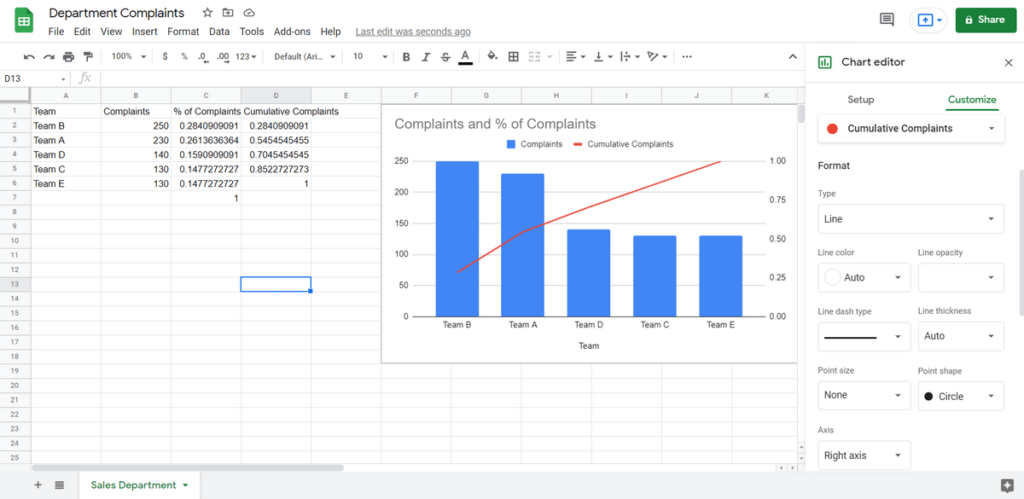
60966 How to Make a Pareto Chart in Google Sheets

The Pareto Chart Google Sheets Guide – 3 Easy Steps

  What is Google Sheets for if not charts and graphs? Charts and graphs are what make Google Sheets so readable. Charts are a form of visual data. While Google Sheets can keep data in columns, rows, and cells, that data isn’t always easy to read at a glance. By using charts like the Pareto […]

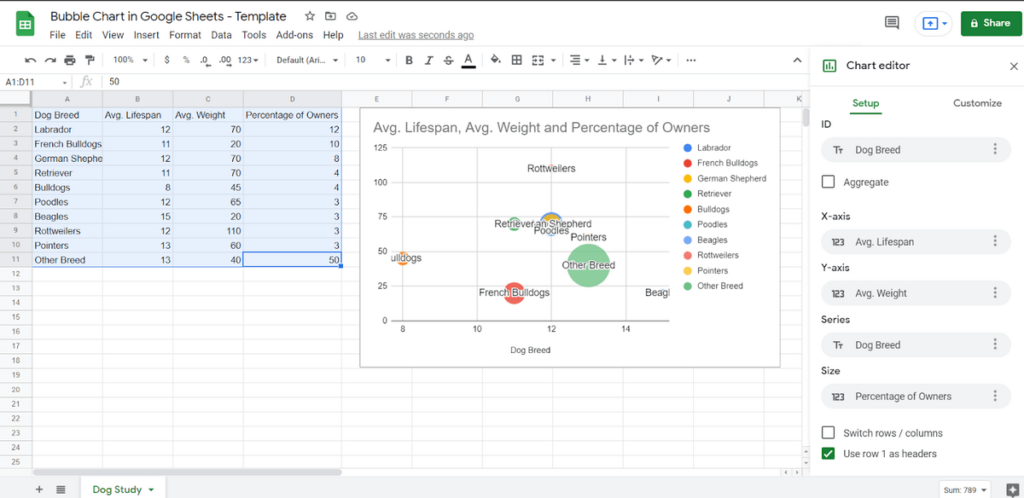
60936 How to Make a Bubble Chart in Google Sheets

Easy Bubble Chart Google Sheets Guide (Free Template)

Bubble Charts are a special type of chart that’s generally used to display multiple dimensions of data. In Google Sheets and Microsoft Excel, there’s a special “Chart” function that includes Bubble Charts. It’s not hard to create a Bubble Chart in Google Sheets, but it can be hard to properly format your data for it. […]

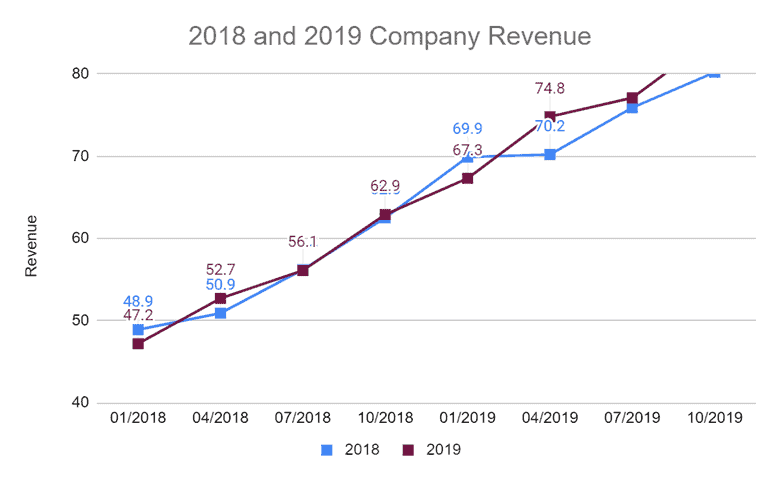
58943Data shown in a line chart in Google Sheets

How to Make a Line Graph in Google Sheets (Step-by-Step)

How to Make a Line Graph in Google Sheets –  Video tutorial: Nothing conveys and represents data as clearly as a line graph. From statistics to evolving data, line graphs are a sure way to record and monitor informational changes accurately. With the use of line graphs, trends clearly appear, allowing individuals and companies alike […]

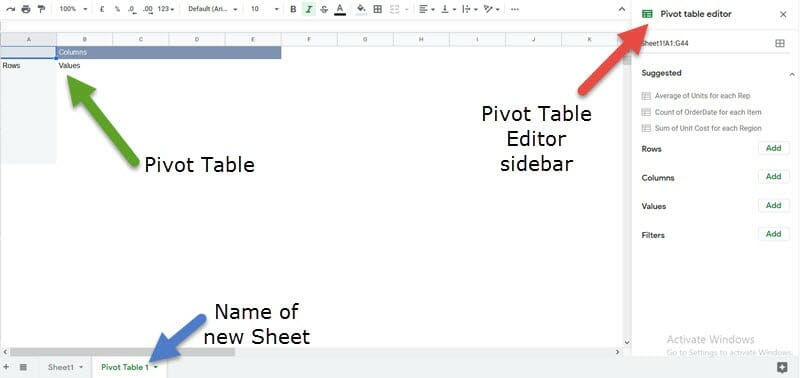
58766 Inserting a Pivot table in Google Sheets

An Easy Pivot Table Google Sheets Guide (Learn in 5 Mins)

Spreadsheets provide a great way to work with data. They help you keep your data organized to get good insights from it. Google Sheets gives the added facility of Pivot tables that makes the data analysis process even more powerful. This pivot table Google Sheets tutorial will give you the jumpstart you need to delve […]

60657how to make a dot plot in google sheets

How to Make a Dot Plot in Google Sheets (Step by Step Guide)

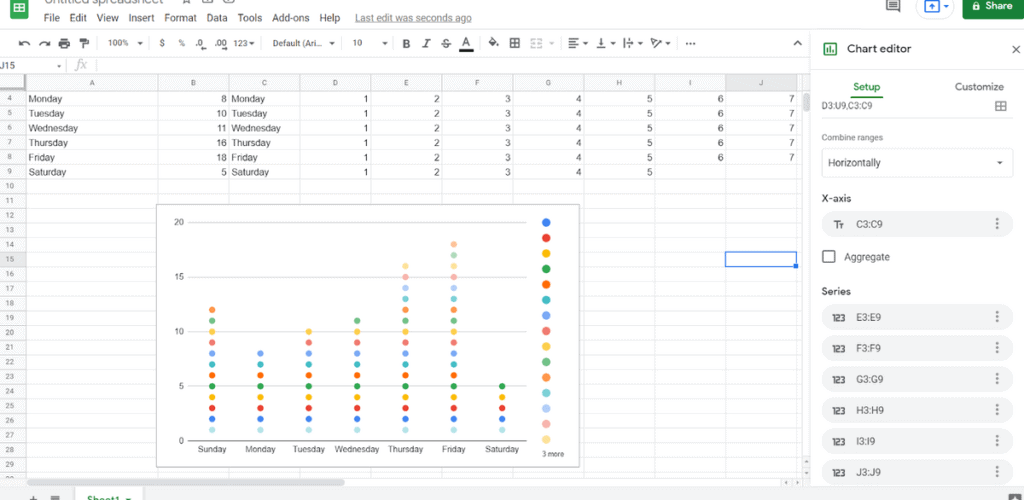
At its most basic, Google Sheets depicts data as a series of columns and rows. But while that can be an accurate way to show data, it isn’t necessarily a compelling one. Google Sheets has a number of “infographic”-like features that make it possible to display information visually. If you’re familiar with reporting functions in […]

60055charts google sheets

How to Create a Candlestick Chart in Google Sheets (Step-by-step)

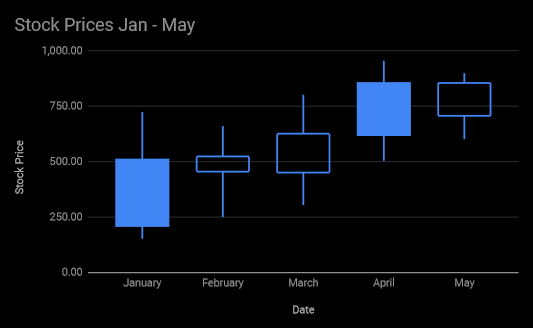
Let’s talk about how to make a candlestick chart in Google Sheets. After all, charts and graphs give you a birds-eye view of your data and help you make inferences. I use a candlestick chart to track variations in values of a variable over time. And it’s not difficult to do. In this tutorial, I’ll […]

59811Both slicer filter conditions are satisfied

How to Use a Google Sheets Slicer

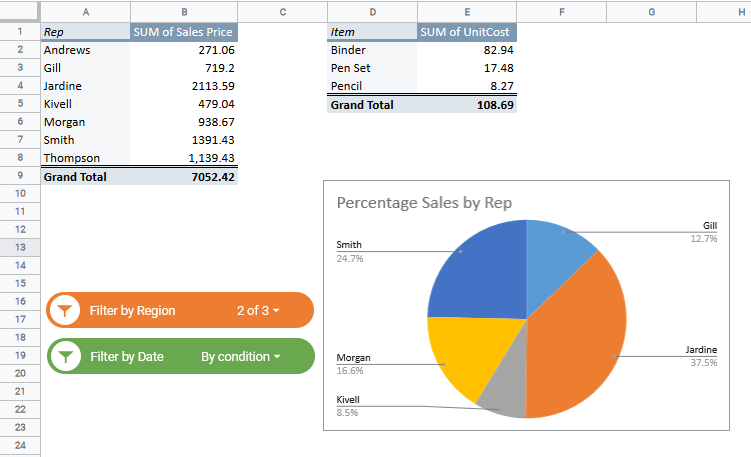
The slicer is a really handy feature of Google Sheets. It enhances the power of Pivot Tables and Pivot Charts in Google Sheets. With a Google Sheets Slicer, you can analyze your data much more interactively. You can create really amazing-looking and interactive reports and dashboards right within your Google Sheets worksheet! In fact, once you’ve […]

59665 Click on Add Values button

How to Add & Use Calculated Fields in Google Sheets Pivot Tables

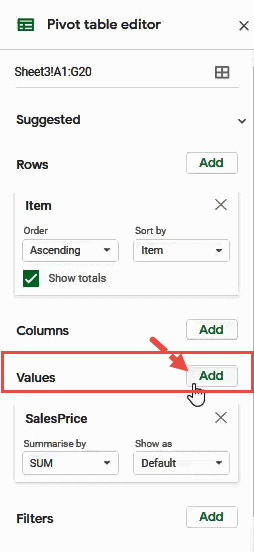
If you’ve worked with Pivot tables, you would know that they are a great way to summarize large sets of data. One, because they let you group data in a wide range of ways, and two, they let you use a number of summarizing metrics to analyze your data. To add to their versatility, pivot […]

59640Data grouped by month and year in Google Sheets Pivot Table

How to Group by Month in Pivot Table in Google Sheets

You can never understand the true power of spreadsheet tools such as Google Sheets and Excel until you master the use of Pivot tables. These tables can bend and turn your data to squeeze out just the information you want to know. In this way, you get to understand your data in ways that simple […]

Access All

Free Templates

Enjoy our custom-made Google Sheets templates for free via email access