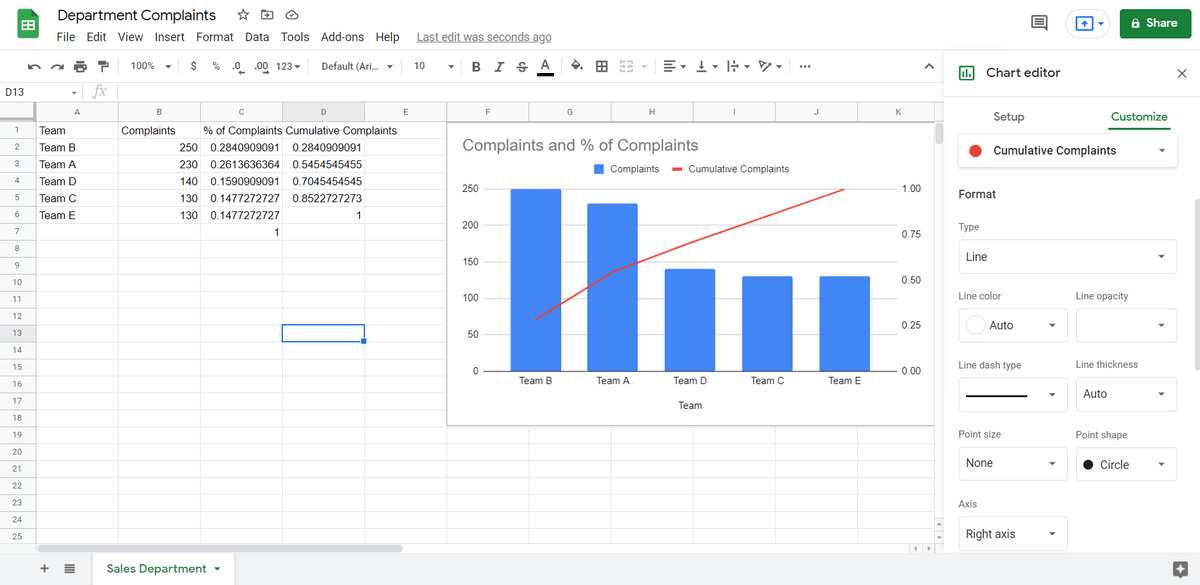
This Pareto Chart Google Sheets guide will show you how to build one of these useful charts in as little as 3 steps. You'll me making them in 10 minutes flat.
...
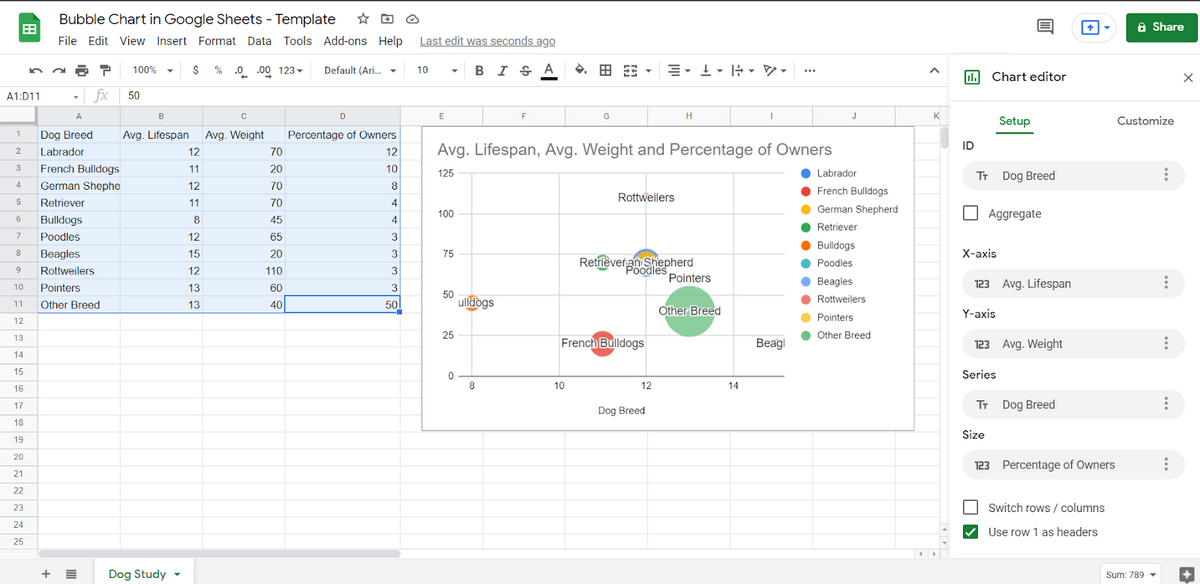
Here's an easy step-by-step tutorial on how to make a bubble chart in Google Sheets, when you should use them, and a free bubble chart Google Sheets template....
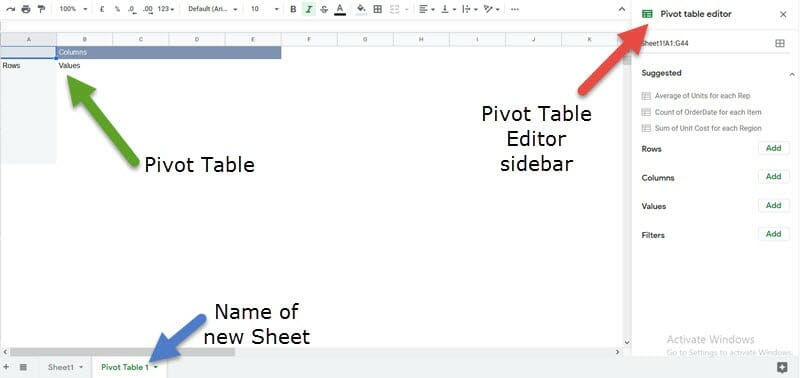
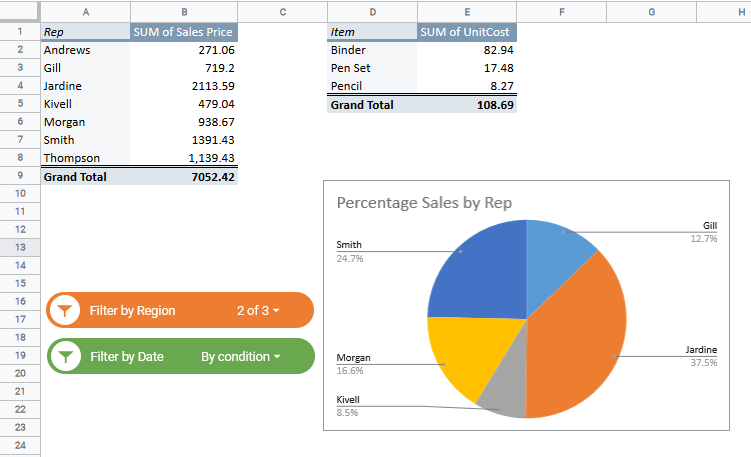
Spreadsheets work well with huge data sets. But, a pivot table can make that data easier to interperet. Follow this pivot table Google Sheets guide to learn....
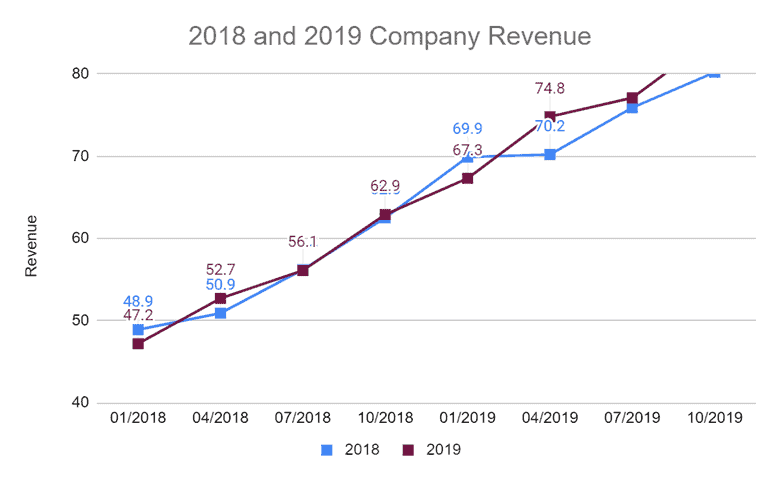
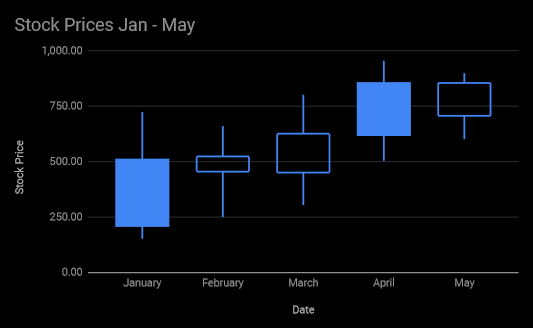
In this tutorial, we will show you how to create a candlestick chart in Google Sheets, as well as how to customize and interpret the displayed results....
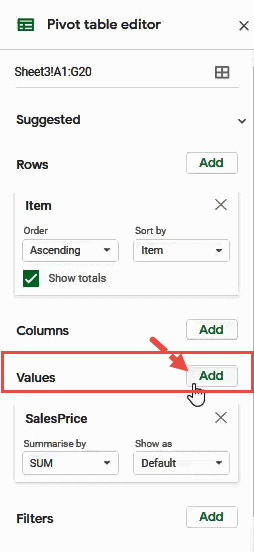
If you’ve worked with Pivot tables, you would know that they are a great way to summarize large sets of data. One, because they let you group data in a wide range of ways, and two, they let you use ...
You can never understand the true power of spreadsheet tools such as Google Sheets and Excel until you master the use of Pivot tables. These tables can bend and turn your data to squeeze out just the ...
Popular Posts
Access All
Free Templates
Enjoy our custom-made Google Sheets templates for free via email access