
60657
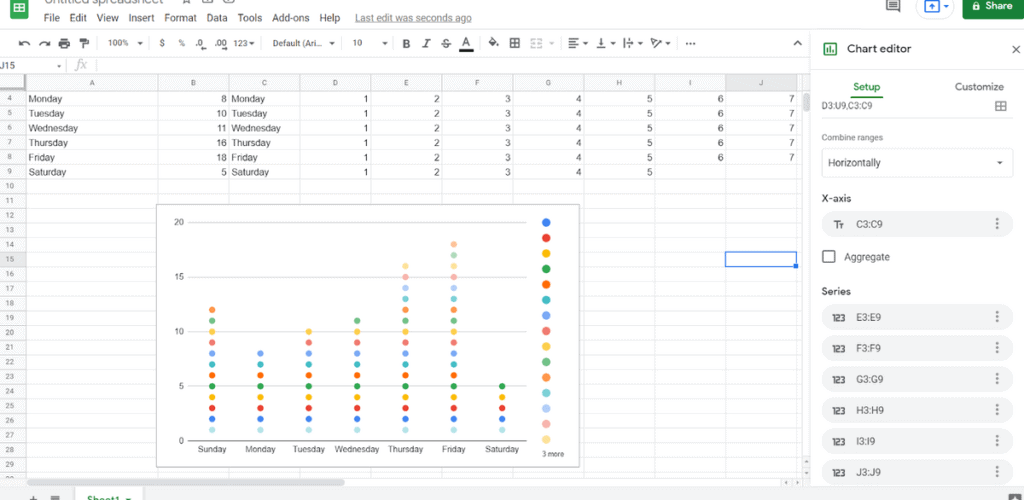
How to Make a Dot Plot in Google Sheets (Step by Step Guide)
At its most basic, Google Sheets depicts data as a series of columns and rows. But while that can be an accurate way to show data, it isn’t necessarily a compelling one. Google Sheets has a number of “infographic”-like features that make it possible to display information visually. If you’re familiar with reporting functions in […]