Let’s discuss the GOOGLEFINANCE function in Google Sheets. It’s an incredibly powerful tool, and I use it often. Follow along to learn how to use GOOGLEFINANCE.

Below, I’ll discuss the function’s use for pulling lie stock quotes into a spreadsheet. I will also include step-by-step instructions on how to use the GOOGLE finance function with real-world examples.
This Article Covers:
Why Would You Need a Google Sheets Stock Price Tracker?
Did you know that Google Sheets isn’t just a powerful spreadsheet application? More than a cloud-based spreadsheet solution, Google Sheets actually has some exceptionally powerful features, owing to its position in the Google ecosystem. That includes the ability to add live Google Sheets stock quotes directly into your spreadsheet.
Because Google has so many utilities, many Google applications (like Google Sheets and Google Docs) can be extended using features like GOOGLEFINANCE. This guide discusses the most common uses.
Notably, the GOOGLEFINANCE Google Sheets function makes it possible to add live stock prices into your Google Sheet. That means you can use it to build your own real, live stock tracker.
And why would you use this function?
Let’s take a look at why you might need a Google Sheets Stocks Tracker, how to get stock price in Google Sheets (or simply download our free Google Sheets stock template below!), and how you can analyze the stock information you pull in.
How to Use Google Sheets’ Stock Price Function for Day Trading
Retail trading has opened the door for many people to “day trade” or invest in their spare time. A lot of people want to track stocks for their financial benefit, as a hobby, or just for their education.
Stocks move fast. The U.S. stock exchange opens at 8:30 EST every morning and continues to operate throughout the day. Many traders need to be able to see live prices to know how much they’ve made (or lost) or to make decisions on investments in the future.
While you probably don’t want to use Google Sheets for critical real-time data, it can be extraordinarily helpful for analysis and reporting. You can pull information both from the current day and from historical results — and you can then analyze that activity using Google Sheets information.
Let’s take a look at how you would use the GOOGLEFINANCE function to make a simple Google Sheets stock tracker.
Understanding the GOOGLEFINANCE Syntax
As always, I like to break down what a function means. Here I’ll show you the parts of the GOOGLEFINANCE function. It’s called the “syntax” and it shows the specific details you’ll need to include to get it to work.
The GOOGLEFINANCE function is able to fetch the current and historical data on Google Sheets stock prices among other things.
The following syntax lets you import stock prices into Google Sheets:
GOOGLEFINANCE(ticker, [attribute], [start_date], [end_date|num_days], [interval])
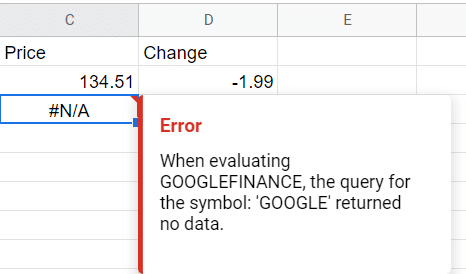
Ticker: This is a unique code or stock symbol used to identify a company in the stock exchange. The GOOGLEFINANCE function uses this stock symbol to return the information about the company’s stocks. If the ticker symbol is not specified, the function will use its own judgment to choose one or return an #N/A error.
- Attribute: This is the specific information about the company that you want the function to retrieve. It includes information like stock price, change, priceopen, high, low, market cap, volume and more. They are usually enclosed in quotation marks unless you use a cell reference. You can find out all the possible attributes and what values they return from the official GOOGLEFINANCE post.
- Start date (Optional): This is only needed when you want to return information from the past. It indicates the first day you want to retrieve data from, and when used alone, the information from that specific day is retrieved.
- End date (Optional): This is the last day if you want to retrieve information from the historical data. When used alone, like the start date, it returns the Google Sheets stock price on the date.
- Interval (Optional): This indicates the frequency of the data you want to retrieve, whether you want daily or weekly information. It only accepts the values 1 for daily and 7 for weekly otherwise, it will return an error.
How to Use the GOOGLEFINANCE Function
When modern stock advisors talk about tech stocks, they usually refer to “FANG”: Facebook, Amazon, Netflix, and Google. These companies aren’t everything in the technology market, but they do represent some of the most powerful movers and shakers.
Today, we’re going to take a look at how to track these four stocks. Here’s how:
Step 1: Create the table headers for each data
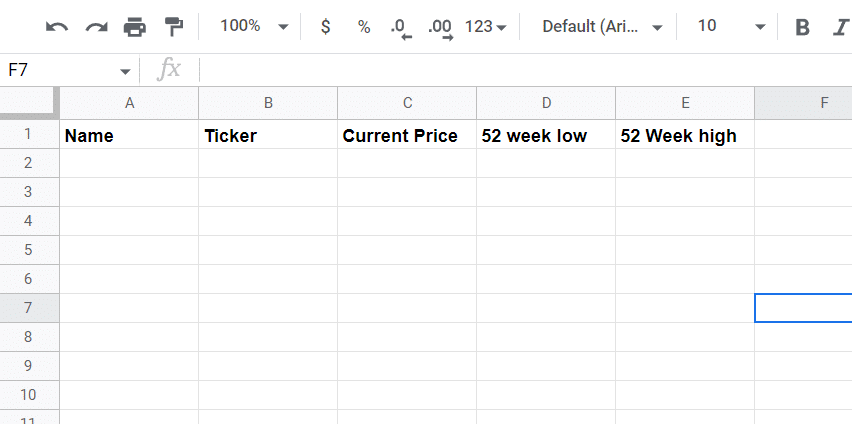
Step 2: Input the company tickers
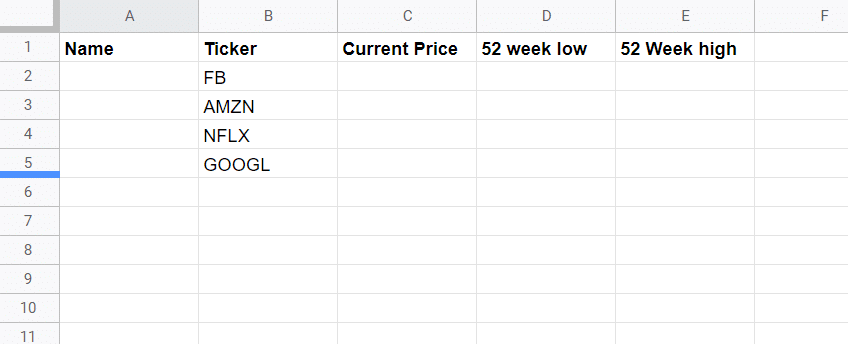
Step 3 : Use the formula:
=GOOGLEFINANCE(B2,"name")
to get the name of each company. You can copy the formula to the rest of the column by dragging down the blue corner box on the cell.
Step 4: Use the formula:
=GOOGLEFINANCE(B2,"Price")
to get the stock price for each company and copy it to the rest of the column
Step 5: Use the formula:
=GOOGLEFINANCE(B2,"low52")
to get the lowest price in the past 52 weeks.
Step 6: Use the formula:
=GOOGLEFINANCE(B2,"high52")
to get the highest price in the past 52 weeks.
In the above Google Sheet, we see:
- Company. The company’s legal name. This is usually just used so that you know which ticker relates to which company, as it can be difficult to determine.
- Ticker. The stock ticker, which is used as its reference on the stock exchange. You might note as you type these in that Google will actually automatically pull up the ticker symbol through its autosuggestions.
- Current Price. The current, active price from GOOGLEFINANCE. This is pulled with GOOGLEFINANCE(ticker,”price”).
- 52-Week Low. Historical data for the lowest the price has been in 52 weeks, pulled from GOOGLEFINANCE. This is pulled with GOOGLEFINANCE(ticker,”low52″).
- 52-Week High. Historical data for the highest the price has been in 52 weeks, pulled from GOOGLEFINANCE. This is pulled with GOOGLEFINANCE(ticker,”high52″).
This is all you would need for basic stock tracking.
As you can see, GOOGLEFINANCE is generally called with the ticker symbol (such as FB or AMZN) and then an attribute name (such as “price,” “low52,” or “high52”). This isn’t a lot of information, but it’s usually what people look at when they’re establishing some basic stock data.
Attributes for the GOOGLEFINANCE Function
We’ve looked at three important functions for GOOGLEFINANCE: price, low52, and high52. But there are actually a lot of other attributes that you can use with GOOGLEFINANCE.
Here are some attributes that have to do with the stock itself:
- Volume. This is the trading volume of the stock. This is how much of the stock is actively trading hands, which can indicate how “popular” the stock is among investors.
- Marketcap. This is the market capitalization of the stock. This tells you how much is actually invested in the stock, and therefore often how much the stock might grow.
- Pe. The price/earnings ratio of the stock. This will tell you whether the stock is undervalued or overvalued compared to its earnings.
- Eps. This is the earnings per share of the stock. Again, this should tell you how the stock’s current value compares to its earnings.
- Shares. This is the total number of shares for the stock. This is important in terms of the market liquidity.
Let’s take a look at our stock sheet with these attributes added:
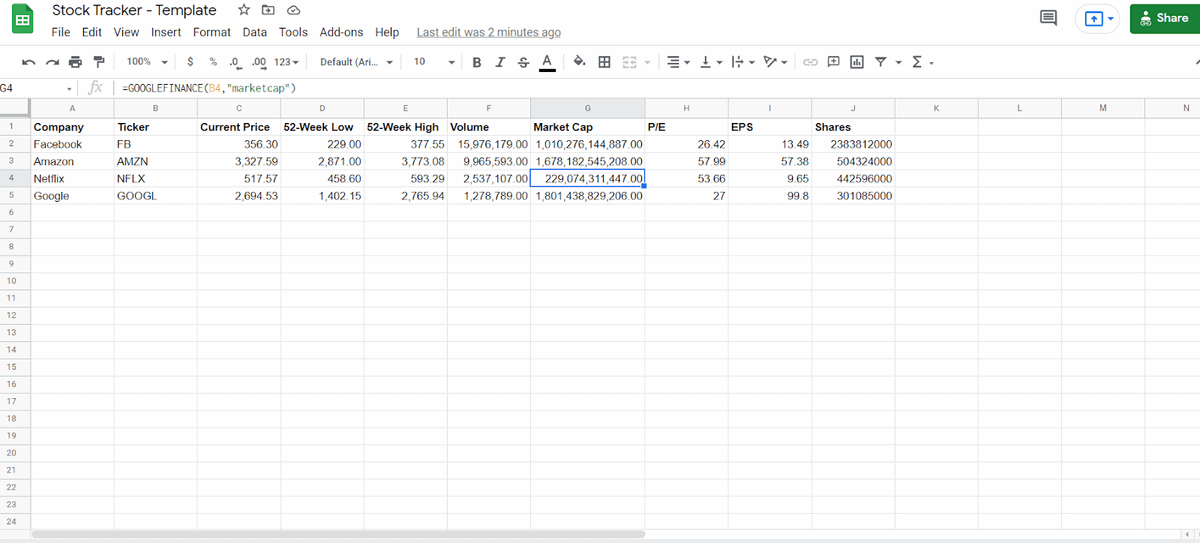
Now we have a lot more stock data on our sheet.
Here are some direct performance attributes:
- Priceopen. This is the price of the stock when the market first opens. Many analysts look at open prices for comparisons and for signals.
- Change. This is the amount of price change the stock has undergone since the previous day’s close. This can show how much trading is being done outside of market hours.
- Closeyest. This is the closing price the stock closed on the prior day. So you’ll be able to see how much it was at the close of the last trading day.
- Changepct. This is the percentage change since the previous day’s close. This can indicate how excited people are about this stock after hours.
You can use any of these attributes very easily, as long as you know the ticker of the stock you’re trying to track. But it should be noted that any of these points of data are merely a form of data analytics; none of them can guarantee any information about the stock or the company.
Completing Basic Analysis with Google Sheets
Why does this matter? Let’s say you’re looking for a FANG stock to invest in, but you want to see the stock with the greatest change percentage from the prior day’s close.
Here, we can see that most of the stocks have gone down, except for Netflix. But there’s an easier way to see this data, too. You can insert a column chart, a candlestick chart, or a pie chart to represent the stock data.
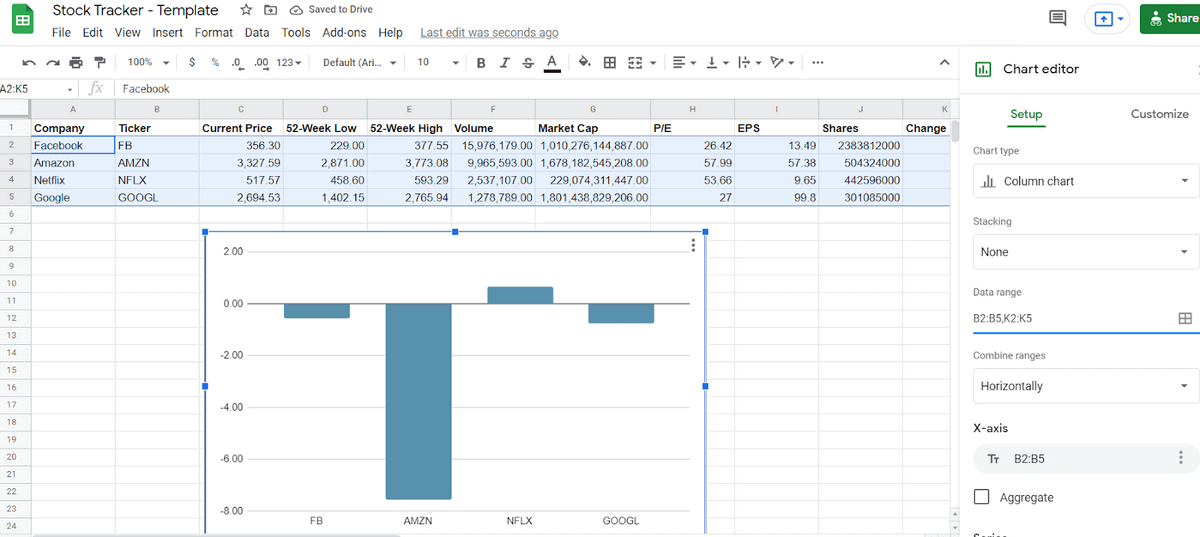
By using Google Sheets’ charting feature, we can better visualize the stock data that we have.
You can also use other formulas like Vlookup and Index to help analyze your stock data. This is one of the reasons you might want to pull GOOGLEFINANCE information into your Google Sheet — so you can perform the analysis functions that are built into Google Sheets.
Showing Price History with GOOGLEFINANCE
We’ve recently discussed how to find net present value with Google Sheets. But what about pulling historical prices? GOOGLEFINANCE does more than pull information about a stock now, it also pulls information about a stock’s price history.
Here’s a real-world example.
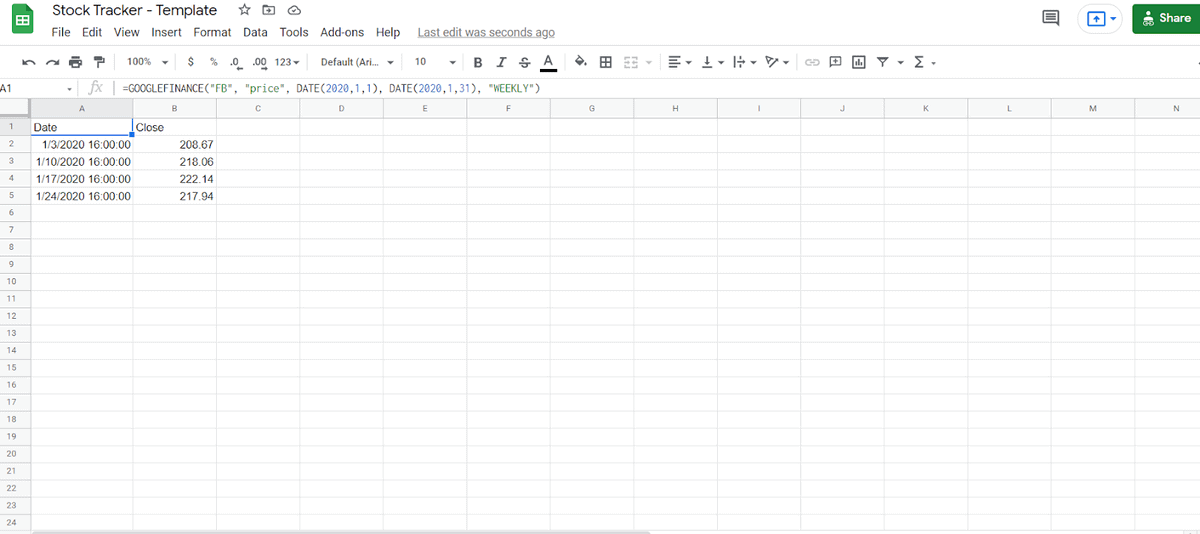
Let’s pull the price history for Facebook from the periods 01/01/2020 to 01/31/2020.
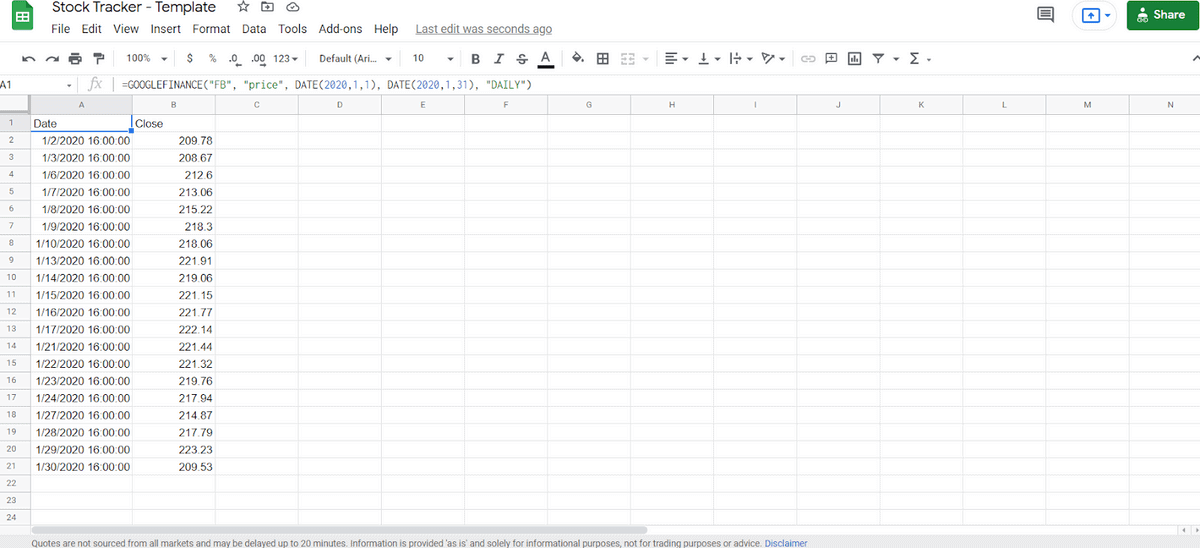
As you can see, this is done through the following formula:
GOOGLEFINANCE("FB","price",DATE(2020,1,1),DATE(2020,1,31),"DAILY")
This is the same pull that was done earlier (FB, price), but this time we have added date variables. We could also pull the price history “WEEKLY” if we wanted to.
And consider if we wanted to price chart this activity:
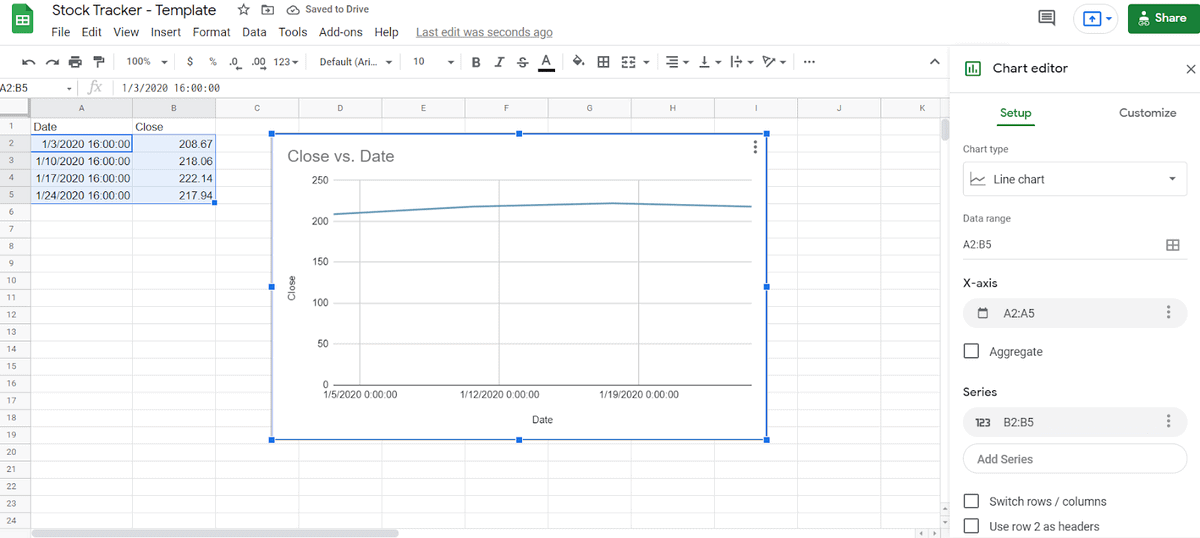
The only real alternative to using GOOGLEFINANCE stock prices would be manually entering each number in — so this is an important (and versatile) function.
How the GOOGLEFINANCE Function Works
It should be noted that the GOOGLEFINANCE function needs to pull data from the Google Finance application each time it loads. When you open your spreadsheet from now on, you’ll see “Loading…” in the cells.
If, for some reason, you can’t access the GOOGLEFINANCE application, the cell data isn’t going to load. You also won’t be able to access this information if you’re editing offline. And if you try to download the spreadsheet as an Excel sheet, it isn’t going to work.
If you are requesting information from the application that it doesn’t have, you’ll receive the error “N/A” for not applicable. This simply means that you’re using the wrong ticker or the wrong attribute.
How Accurate is GOOGLEFINANCE?
GOOGLEFINANCE should be extremely accurate. It pulls data from known sources in real-time. It’s the same information you will receive if you search Google for the current, active stock price. But because GOOGLEFINANCE queries can slow your sheet down (and because they rely on you pulling information from the API), they may not provide results down to the second.
For that reason, GOOGLEFINANCE should really be used more for stock analysis rather than real-time reporting.
Google Sheets Stock Template
You can get started now using our Google Sheets Stock Template.
Just click File -> Make a Copy so that you have your own customizable version.
You can use the Google Sheets Stock Template to track any stock listed on the public stock exchange.
A few reasons you might use a Google Sheets Stock Template include:
- Tracking stocks that you’ve already invested in. You can use a sheet to determine when you’re going to sell stocks, or just how much you’ve made in your existing stocks.
- Looking for signals that you should invest in stocks. You can set points at which you might enter into a stock, such as if its 52-week low goes up by a certain percentage.
- Comparing different companies. You can take a look at any number of companies using a Google Sheets Stock Template, whether it’s just a few of them or dozens of them.
- Creating reports for how stocks perform over time. Using GOOGLEFINANCE, you can pull information for certain dates — which you can use to determine the progress of stocks.
At the end of the day, managing live stock prices in Google Sheets is going to be less about Google Sheets and more about understanding how the stock market works. Without an understanding of how the stock market works, it’s difficult to determine what different attributes mean. And if you don’t know what those attributes mean, you can’t perform the right analysis.
Frequently Asked Questions (And Troubleshooting the Stock Ticker in Google Sheets)
Let’s talk about some common issues and questions associated with the GOOGLEFINANCE function. Below, I help with the issues I most commonly encounter when using this tool.
Can Google Sheets Pull the Current Stock Price?
Yes! You can get the current stock price in Google Sheets using the GOOGLEFINANCE function. If you use the basic GOOGLEFINANCE formula which is =GOOGLEFINANCE([ticker], [price]), it will usually give you the most recent price.
For example, if we wanted to find Apple’s current stock price, we would do the following:
- Get Apple ticker which is APPlin the first column
- In the column for price input the formula =GOOGLEFINANCE(A2,”Price”) this will give you the current stock price
- You can also add a column for price change to show the difference between the current stock price and the previous day’s stock price. Use the following formula to get the change: =GOOGLEFINANCE(A2,”Change”).
However, it is important to note that there is usually a delay of about 20 minutes.
Why Doesn’t Google Sheets Recognize My Formula?
There are several reasons why Google Sheets might not recognize your formula. Usually, it’s a problem with the elements of the function. Check out the syntax of the GOOGLEFINANCE function above. That should help make sure your elements are properly formatted.
Another common issue is when you need to convert text to numbers in Google Sheets. Sometimes, the way you paste data might be misinterpreted as words instead of numerals. My guide can help with that too.
How Do You Automatically Update Stock Prices in Google Sheets?
Google Sheets usually updates the GOOGLEFINANCE function every 15 minutes. You can also go to the settings to change how often the sheet updates formulas.
- Go to File > Settings
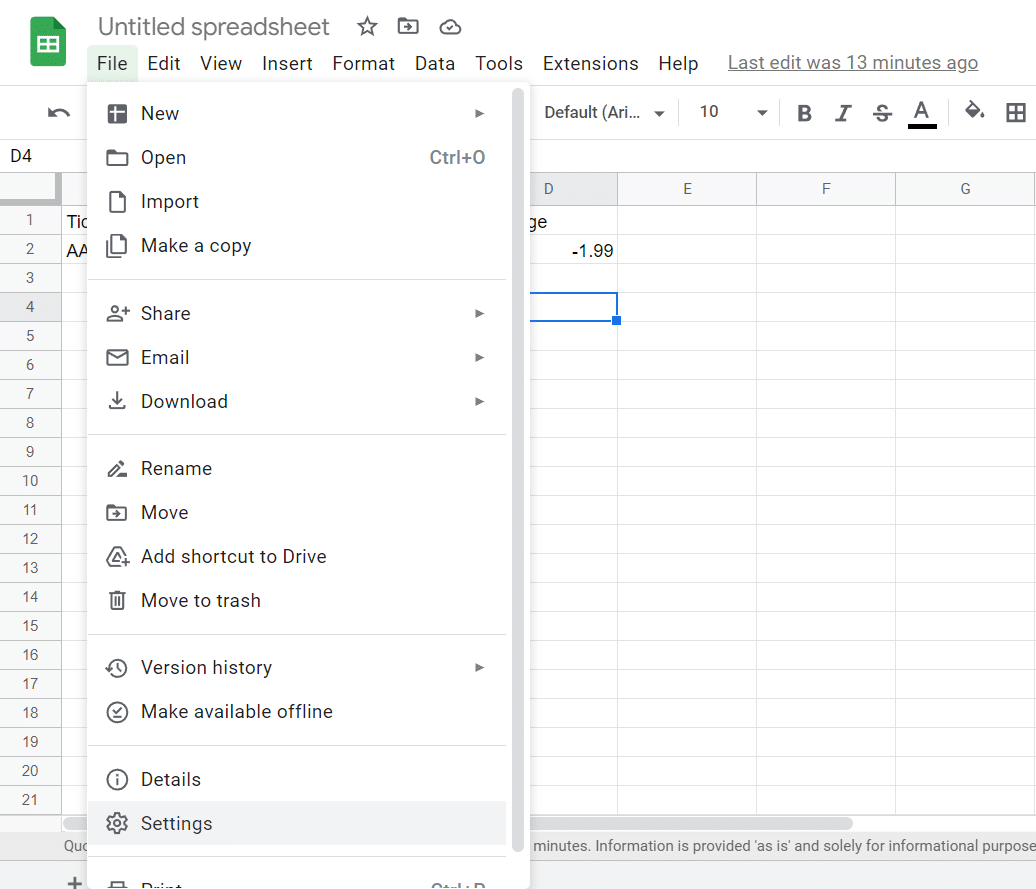
- In the Settings window, go to Calculation
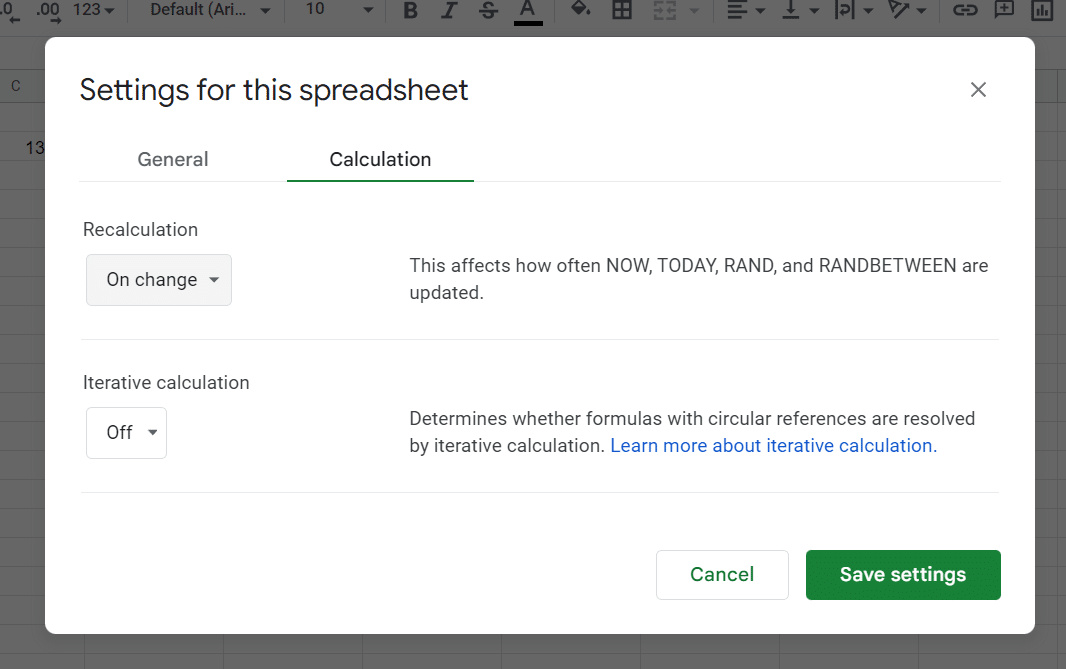
- Click the recalculation drop down menu. You have 3 options.
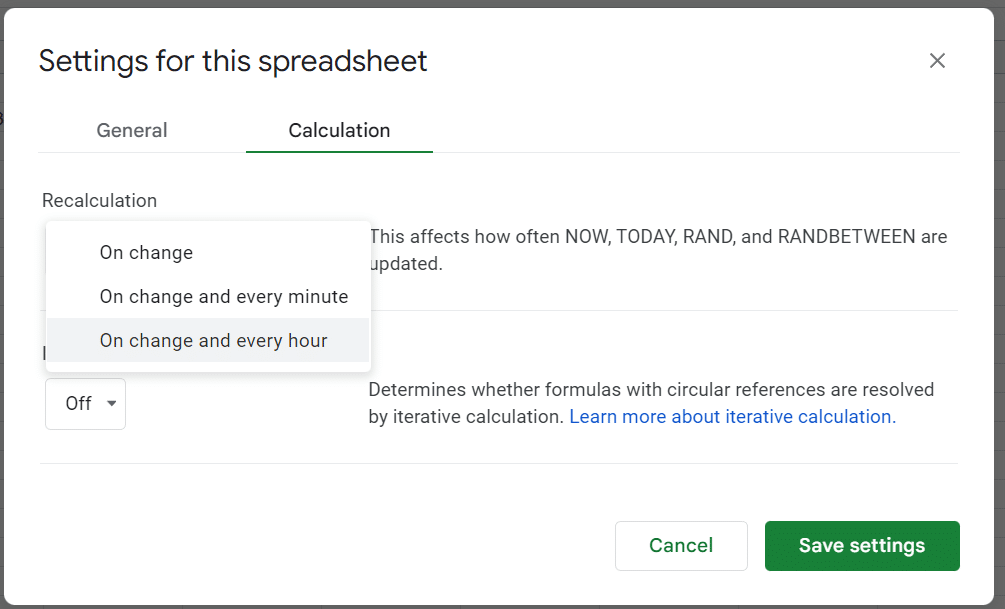
- Select the interval you want to use
- Click save settings.
However, if you would like faster updates, then you can change the update interval by adding a script.
Conclusion
After following everything in our stock price Google Sheets guide, you should now know how to get stock prices in Google Sheets using the GOOGLEFINANCE function. If you need to pull the information into an application, you can also use the Google Finance API, or you can use Google Finance directly.
But the GOOGLEFINANCE function is exceptionally useful for having Google Sheets get stock price for those who want to do their own analysis, data collection, and reporting in Google Sheets. Happy trading